In today’s fast-paced business landscape, the sheer volume of data generated by organizations can be both a blessing and a curse. While it holds the potential for unprecedented clarity and strategic advantage, sifting through mountains of raw information can feel like searching for a needle in a digital haystack. This is where the true power of analytics dashboards comes into play, transforming complex datasets from your Enterprise Resource Planning (ERP) and Customer Relationship Management (CRM) systems into actionable, visual insights. These powerful tools are not just pretty charts; they are the command centers for data-driven decision-making, offering a panoramic view of your operations and customer interactions.
Imagine having a single pane of glass that shows you everything from your current inventory levels and supply chain efficiency to real-time sales performance and customer satisfaction scores. This holistic perspective, derived from the rich veins of ERP and CRM data, empowers businesses to move beyond guesswork and react to market dynamics with agility and precision. This article delves deep into how leveraging analytics dashboards for insights from ERP and CRM data can revolutionize your strategic planning, operational efficiency, and customer engagement, ultimately driving sustainable growth and a competitive edge.
Understanding the Landscape of Modern Business Intelligence
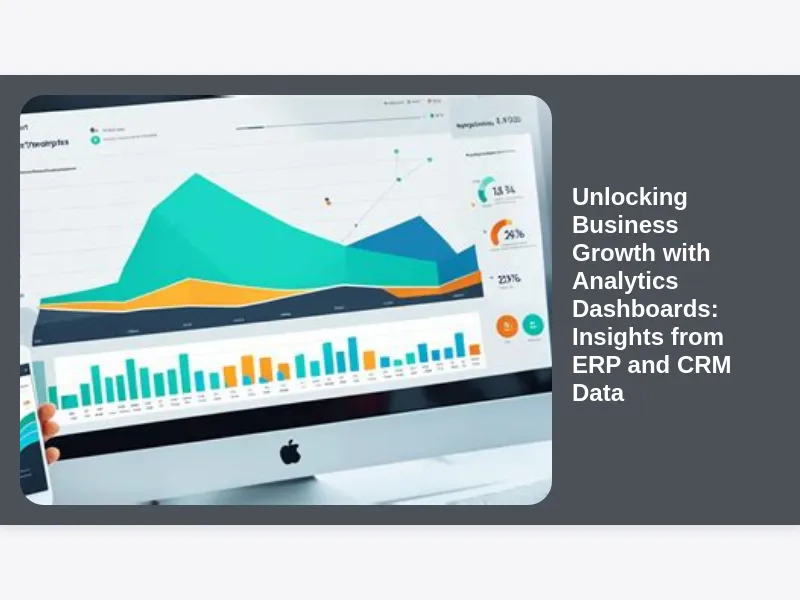
Before we dive into the specifics of ERP and CRM data, it’s crucial to grasp what analytics dashboards truly are and why they have become indispensable. At their core, dashboards are visual displays of key performance indicators (KPIs) and metrics, designed to provide a quick, at-a-glance understanding of a specific objective or business area. They aggregate data from various sources, presenting it through charts, graphs, tables, and gauges, making complex information accessible and interpretable for users across all levels of an organization.
These aren’t static reports; modern analytics dashboards are often interactive, allowing users to drill down into specific data points, filter information, and customize views to answer specific questions. This interactivity transforms passive data consumption into an active exploration, fostering a deeper understanding of underlying trends and anomalies. The primary goal is to empower stakeholders—from executives to frontline staff—to make informed decisions faster, without needing to be data scientists themselves.
The Foundation: Why ERP and CRM Data Are Pivotal for Insights
The bedrock of truly insightful analytics dashboards lies in the quality and relevance of the underlying data. When it comes to comprehensive business understanding, two systems stand out as primary data reservoirs: Enterprise Resource Planning (ERP) and Customer Relationship Management (CRM) systems. Each collects a distinct yet complementary set of information, and when combined, they offer an unparalleled 360-degree view of your business.
ERP systems are the backbone of your operations, managing everything from finance, human resources, manufacturing, and supply chain to project management. They track internal processes, costs, efficiencies, and resource allocation. CRM systems, on the other hand, are the lifeblood of your customer interactions, managing sales, marketing, and customer service activities. They hold vital information about customer demographics, purchase history, communication logs, and support tickets. The magic truly happens when insights from ERP and CRM data are merged on powerful analytics dashboards.
Unlocking Operational Efficiency with ERP Data Insights
ERP systems are treasure troves of operational data that, when properly visualized, can unlock significant efficiencies and cost savings. Think about the granular details an ERP captures: inventory levels, production schedules, procurement costs, financial transactions, and even employee performance metrics. Without effective visualization, this data can remain siloed and underutilized, failing to inform crucial operational decisions.
Analytics dashboards built on ERP data can provide real-time visibility into your supply chain, highlighting bottlenecks, predicting stock shortages, or identifying opportunities for optimized logistics. For finance teams, these dashboards can offer instant access to cash flow statements, profit and loss reports, and budget vs. actuals, enabling proactive financial management. Manufacturing operations can track production output, machine downtime, and quality control metrics, leading to improved throughput and reduced waste. The ability to quickly identify deviations from planned performance allows for immediate corrective action, transforming reactive management into proactive optimization.
Driving Revenue and Customer Satisfaction with CRM Dashboard Benefits
CRM systems hold the keys to understanding your customers, and effectively visualizing this data is paramount for driving sales, improving marketing effectiveness, and enhancing customer satisfaction. From lead generation to post-sales support, CRM platforms track every interaction, preference, and historical purchase. Harnessing this wealth of information through analytics dashboards allows businesses to personalize customer experiences and anticipate needs.
Imagine a sales dashboard displaying the entire sales pipeline, showcasing conversion rates at each stage, identifying high-performing sales representatives, and predicting future revenue. A marketing dashboard can track campaign performance, customer acquisition costs, and segment customer behavior to tailor future outreach. For customer service, dashboards can monitor average resolution times, customer feedback scores, and common support issues, leading to improved service delivery. By visualizing CRM data, businesses can foster stronger customer relationships, reduce churn, and pinpoint opportunities for upselling and cross-selling, directly impacting the bottom line.
Connecting the Dots: Strategic Data Integration for Holistic Views
The true transformative power of analytics dashboards: insights from ERP and CRM data emerges when these two distinct data sources are seamlessly integrated. While each system provides valuable insights independently, a unified view allows for a much deeper and more nuanced understanding of the business ecosystem. For instance, knowing that a customer bought a certain product (CRM data) becomes infinitely more powerful when you also know the production cost and inventory availability of that product (ERP data).
Data integration strategies range from direct API connections and data warehousing to specialized business intelligence connectors. The goal is to create a single, consistent version of truth, eliminating data silos and ensuring that all departments are working from the same factual foundation. This integrated approach allows for cross-functional analysis, such as linking marketing campaign spend (CRM) to actual product profitability (ERP), or understanding how customer support issues (CRM) might correlate with product returns or quality control data (ERP). Without robust integration, the potential of these powerful data sources remains largely untapped, limiting the depth of insights available for your analytics dashboards.
Designing Effective Analytics Dashboards: Principles for Clarity and Action
Simply having data from ERP and CRM is not enough; the way it’s presented on analytics dashboards significantly impacts its utility. A poorly designed dashboard can be as unhelpful as no dashboard at all, leading to confusion, misinterpretation, or simply being ignored. Effective dashboard design is an art and a science, focusing on clarity, conciseness, and actionability.
Key principles include identifying the target audience and their specific needs, selecting the most relevant KPIs, and choosing appropriate visualization types (e.g., line charts for trends, bar charts for comparisons, pie charts for proportions). Dashboards should be intuitive, easy to navigate, and consistent in their layout and color schemes. Avoid clutter; less is often more. The goal is to tell a compelling story with data, guiding the viewer’s eye to the most critical information and prompting them to ask further questions or take immediate action. A well-designed dashboard doesn’t just display data; it inspires insight and drives decision-making.
Real-time vs. Historical Data: A Balanced Approach for Dynamic Insights
When building analytics dashboards, a critical consideration is the balance between real-time data and historical trends. Real-time data provides an immediate pulse on current operations, allowing for agile responses to unfolding events. For instance, a real-time sales dashboard can show hourly revenue, while a real-time inventory dashboard can alert to immediate stockouts. This instant visibility is crucial for operational decision-making, enabling quick adjustments to production, sales strategies, or customer service interventions.
However, historical data is equally vital for understanding long-term trends, identifying patterns, and making strategic forecasts. By analyzing historical ERP data, you can uncover seasonal demand fluctuations, track cost variations over time, or assess the effectiveness of past process improvements. Similarly, historical CRM data reveals customer lifetime value trends, successful marketing campaign archetypes, and evolving customer behaviors. The most effective analytics dashboards skillfully integrate both, providing a current snapshot within the context of past performance, enabling both tactical responsiveness and strategic foresight.
Sales Performance Dashboards: Driving Revenue Growth and Strategic Selling
One of the most immediate and impactful applications of analytics dashboards: insights from ERP and CRM data is in optimizing sales performance. A dedicated sales performance dashboard can be a game-changer for sales managers and individual representatives alike. From lead source effectiveness to sales funnel conversion rates, and from individual rep performance to regional sales trends, these dashboards provide the transparency needed to fine-tune sales strategies.
Such dashboards can showcase key metrics like average deal size, sales cycle length, win rates, and forecast accuracy. By integrating CRM data on customer interactions and ERP data on product profitability, sales teams can prioritize high-value leads and focus on selling products with better margins. This granular visibility allows for proactive coaching, targeted training, and the identification of successful selling behaviors that can be replicated across the team. Ultimately, well-crafted sales dashboards empower organizations to not only meet but exceed revenue targets by making data-driven decisions about sales strategies, resource allocation, and market penetration.
Customer Service Analytics: Enhancing Satisfaction and Retention
Beyond sales, CRM data is invaluable for enhancing customer service and building lasting relationships. Analytics dashboards focused on customer service can transform how organizations respond to and anticipate customer needs, significantly impacting satisfaction and retention rates. These dashboards move beyond simply tracking the number of calls, offering deeper insights into the quality and efficiency of service delivery.
Key metrics visualized on customer service dashboards often include average handle time, first call resolution rates, customer satisfaction (CSAT) scores, net promoter scores (NPS), and even sentiment analysis from customer interactions. By linking this CRM data with ERP insights on product issues or delivery delays, businesses can identify root causes of customer dissatisfaction. For example, a dashboard might reveal a surge in support tickets related to a specific product batch (CRM data) which can then be correlated with a production issue identified in the ERP system. This holistic view enables organizations to address systemic problems, streamline support processes, and proactively engage with at-risk customers, fostering loyalty and advocacy.
Financial Health Dashboards: Overseeing the Bottom Line and Ensuring Fiscal Prudence
For any business, maintaining a clear picture of its financial health is paramount, and analytics dashboards powered by ERP data are indispensable for achieving this. Financial dashboards provide executives and finance teams with instant, digestible insights into the organization’s fiscal performance, allowing for continuous monitoring and proactive management of resources. They move beyond traditional static reports, offering dynamic views that can be tailored to specific needs.
These dashboards typically display critical financial KPIs such as revenue, expenses, profit margins, cash flow, accounts receivable and payable, budget vs. actuals, and key liquidity ratios. By visualizing trends over time, financial dashboards help identify potential issues like declining profit margins or increasing operational costs before they escalate into major problems. They also support strategic financial planning by providing data-backed insights into investment opportunities, cost-saving initiatives, and capital allocation. The ability to drill down into specific expense categories or revenue streams offers unprecedented transparency, ensuring fiscal prudence and supporting sound financial decision-making based on robust insights from ERP and CRM data.
Supply Chain Optimization Through Analytics: Efficiency from End to End
The supply chain is often the most complex and costly part of an operation, making it ripe for optimization through analytics dashboards. Leveraging the detailed operational data within ERP systems, businesses can gain unprecedented visibility into every stage of their supply chain, from procurement to production and delivery. These dashboards are critical for identifying inefficiencies, mitigating risks, and ensuring smooth, cost-effective operations.
Supply chain analytics dashboards can track inventory levels across multiple warehouses, monitor supplier performance, analyze shipping costs and delivery times, and even predict potential disruptions based on historical patterns or external factors. By integrating real-time ERP data on production schedules and order fulfillment, companies can optimize inventory management, reduce carrying costs, and prevent stockouts or overstock situations. Furthermore, linking this with CRM data on customer demand and order patterns allows for a demand-driven supply chain, ensuring that products are available when and where customers need them, leading to increased customer satisfaction and significant operational savings.
Predictive Analytics: Peering into the Future with ERP and CRM Insights
While most analytics dashboards focus on historical and real-time data, the next frontier involves predictive analytics, which leverages past trends from ERP and CRM data to forecast future outcomes. This sophisticated application moves beyond merely understanding what happened or what is happening, to anticipating what will happen, enabling truly proactive strategies.
For instance, predictive models built on CRM data can forecast customer churn, identifying at-risk customers before they leave, allowing for targeted retention efforts. They can also predict future sales based on historical purchasing patterns, marketing campaign effectiveness, and external market indicators. On the ERP side, predictive analytics can forecast demand for specific products, optimize inventory levels to meet future needs, or predict equipment maintenance requirements, preventing costly downtime. While more complex to implement, integrating predictive insights into your analytics dashboards elevates them from reporting tools to strategic forecasting instruments, providing a significant competitive advantage by preparing businesses for tomorrow’s challenges and opportunities today.
Overcoming Common Challenges in Dashboard Implementation
Implementing effective analytics dashboards that leverage insights from ERP and CRM data is not without its challenges. One of the most common hurdles is data quality. If the underlying ERP and CRM data is incomplete, inconsistent, or inaccurate, even the most sophisticated dashboard will yield misleading insights. Addressing data cleanliness, standardization, and governance is a critical prerequisite.
Another significant challenge lies in user adoption. A dashboard, no matter how well-designed, is useless if employees don’t use it or understand how to interpret its information. This often stems from a lack of proper training, an unclear understanding of the dashboard’s purpose, or a perception that it adds to their workload rather than simplifies it. Overcoming these challenges requires clear communication, comprehensive training programs, user-friendly design, and a culture that champions data-driven decision-making from the top down. Furthermore, initial scope creep or trying to include too many metrics can overwhelm users, highlighting the need for iterative development and user feedback.
Choosing the Right Analytics Platform: Factors Beyond Features
The market is flooded with business intelligence and analytics platforms, making the choice of the right tool a crucial decision for leveraging analytics dashboards: insights from ERP and CRM data. Beyond merely looking at a list of features, organizations must consider several factors to ensure the platform aligns with their specific needs and future growth.
Scalability is key; the chosen platform must be able to handle increasing volumes of data and a growing number of users without compromising performance. Integration capabilities are paramount—how easily does it connect with your specific ERP and CRM systems, as well as other data sources? User-friendliness and intuitiveness are critical for broad adoption across different departments and skill levels. Security features, mobile accessibility, and the availability of robust support and a vibrant user community are also important considerations. Often, a proof-of-concept or pilot program with a few leading candidates can help validate the best fit before a full-scale investment, ensuring the platform truly empowers your organization to extract meaningful insights from its data.
Best Practices for Maximizing Dashboard Adoption and Impact
Even the most technologically advanced analytics dashboards will fail to deliver value if they are not adopted and utilized effectively by the target audience. Maximizing the impact of your dashboards requires more than just technical implementation; it demands a strategic approach to change management and continuous improvement.
One best practice is to involve end-users in the dashboard design process from the very beginning. This co-creation fosters a sense of ownership and ensures that the dashboards address real business needs and answer relevant questions. Providing comprehensive, ongoing training is crucial, not just on how to navigate the dashboard, but more importantly, on how to interpret the data and translate insights into action. Creating a “data champion” or dedicated support system can help users overcome initial hurdles. Regular reviews and updates based on user feedback ensure that dashboards remain relevant and valuable over time. Ultimately, integrating dashboard usage into daily workflows and decision-making processes, and celebrating successes achieved through data insights, cultivates a culture where analytics dashboards become indispensable tools for driving business growth.
Measuring the ROI of Your Analytics Investment: Justifying the Cost
Implementing sophisticated analytics dashboards: insights from ERP and CRM data represents a significant investment in terms of time, resources, and technology. Therefore, demonstrating a clear return on investment (ROI) is crucial for justifying the expenditure and securing continued executive buy-in. While some benefits, like improved decision-making, can be intangible, many can be quantified.
ROI can be measured through various metrics. For sales dashboards, look at increases in conversion rates, average deal size, or reductions in sales cycle length. For operational dashboards fueled by ERP data, measure reductions in inventory carrying costs, improvements in production efficiency, or decreases in supply chain waste. Customer service dashboards can show ROI through higher customer retention rates, reduced churn, or lower support costs due to improved first-call resolution. By tracking these key performance indicators before and after dashboard implementation, and attributing measurable improvements to the data-driven insights, businesses can clearly articulate the financial benefits and justify the ongoing investment in their analytics capabilities.
The Future of Analytics Dashboards: AI, Machine Learning, and Beyond
The evolution of analytics dashboards: insights from ERP and CRM data is far from over. The future promises even more intelligent, proactive, and personalized insights, largely driven by advancements in Artificial Intelligence (AI) and Machine Learning (ML). These technologies are transforming dashboards from static reporting tools into dynamic, predictive, and even prescriptive advisors.
Imagine dashboards that automatically identify significant anomalies in your ERP financial data, sending alerts to the finance team, or CRM dashboards that predict which customers are likely to churn next week and suggest proactive retention strategies, all without a human explicitly setting up the rules. AI and ML can automate data preparation, discover hidden correlations, and even generate natural language explanations of complex trends, making insights even more accessible to non-technical users. The integration of advanced analytics, natural language processing, and real-time data streams will make future analytics dashboards indispensable strategic partners, enabling businesses to not just react to data, but to anticipate, predict, and ultimately shape their future.
Success Stories: How Businesses Thrive with Integrated Analytics Dashboards
Countless businesses across various industries have already reaped significant rewards by strategically implementing analytics dashboards that unify their ERP and CRM data. Consider a retail company that integrated its point-of-sale data (often part of ERP) with its customer loyalty program data (CRM). By visualizing these combined insights, they could identify peak shopping hours, popular product combinations, and the effectiveness of specific promotions on customer retention, leading to optimized staffing, merchandising, and marketing campaigns.
Another example is a manufacturing firm that integrated its production efficiency data (ERP) with customer order data (CRM). Their analytics dashboards allowed them to identify production bottlenecks that were directly impacting delivery times for key customers, enabling them to reallocate resources and communicate proactively, significantly improving customer satisfaction and reducing missed delivery penalties. These success stories underscore that the true value of analytics dashboards: insights from ERP and CRM data lies not just in collecting information, but in transforming it into a powerful engine for continuous improvement and strategic growth across the entire organization.
Conclusion: Empowering Your Enterprise with Data-Driven Decisions
In an era defined by information overload, the ability to distil vast amounts of data into clear, actionable insights is no longer a luxury but a necessity for survival and growth. Analytics dashboards: insights from ERP and CRM data stand as pivotal tools in this quest, transforming raw numbers into strategic advantages. They provide a unified, visual narrative of your operational efficiency and customer engagement, empowering every level of your organization to make faster, smarter, and more informed decisions.
By embracing these powerful visualization tools, integrating your core business data, and fostering a data-driven culture, you equip your enterprise with the clarity needed to navigate market complexities, optimize internal processes, enhance customer relationships, and ultimately, secure a sustainable competitive edge. The journey towards becoming a truly data-driven organization begins with unlocking the potential hidden within your ERP and CRM systems, and there is no more effective key than a well-designed, insightful analytics dashboard. Invest in your data, visualize your insights, and watch your business thrive.